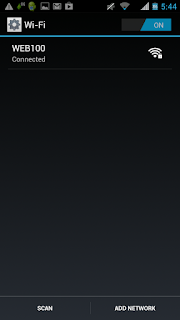
For Android devices:
a. Go to Options – Wi-Fi, long tap on the current network connection and choose the “Modify Network” popup menu item;
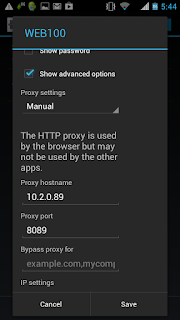
b. Check “Show advanced options” checkbox;
c. Set parameter “Proxy settings” to “Manual”;
d. In the field “Proxy hostname” type the IP of the computer (for example, 10.2.0.89), into the field “Proxy port” our port – 8089;
e. Save changes.
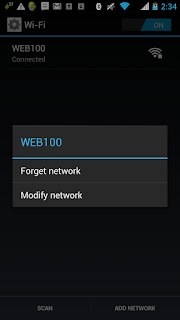
a. Go to Options – Wi-Fi, long tap on the current network connection and choose the “Modify Network” popup menu item;
b. Check “Show advanced options” checkbox;
c. Set parameter “Proxy settings” to “Manual”;
d. In the field “Proxy hostname” type the IP of the computer (for example, 10.2.0.89), into the field “Proxy port” our port – 8089;
e. Save changes.


